Load testing with k6 and New Relic

I set about integrating my Node Workshop demonstration app with k6 performance testing. Find the integration docs here.
This is a story of the analysis I performed on the demo app, how I revisited my AWS Elastic Beanstalk scaling rules as a result, and how I can make the most out of New Relic for performance learnings. It will also demonstrate how I HALVED response time in my application by properly scaling out CPU intensive web requests.
For transparency, I work at New Relic and have done for the last two years, and have worked in the Observability space for the last 5 years. k6 was new to me as of a few months ago when I seen a customer of ours using them, which introduced me to what they do.
Starting the test
In the setup() of the k6 test.js, I am using a few calls into New Relic. This does a few things:
- Makes a call into New Relic NerdGraph to check the health status of the application before the test is run.
- Sends a deployment marker for the New Relic monitored application, informing the UI and deployments service that a deployment is going ahead.

Make sure to be running the k6 New Relic integration and have it selected as an output. You can use the output of StatsD or DataDog (also StatsD, supporting tags). Despite the name, the results go to New Relic 😉 it is just about the backend implementation on k6 — revamped outputs are planned (targeting k6 v0.31.0). We will update the docs when it is ready.

My test is running and I can see the large increase in web transaction time, and throughput reflecting this in New Relic. My Apdex score is about to take a hit!
Result Visualisation while the test is running

The time to glass in New Relic is almost immediate, so I can keep a track of my test within there and the impact faced on the monitored services. I have a dashboard visualising the k6 output. I selected eight metrics important to me, but there is a far greater list to the right hand side you can see.

From this screen on my dashboard I can see in the top left there that once the new instances are added the utilisation does indeed drop — a take away for me is speeding up that scaling time, which I will come on to.

Another finding I can see from above is that my error rate is particularly high. This is impacting my Apdex score.

I can see that my application recovers after it has scaled properly, and also quickly returns back to normal once the load test has stopped.
Making revisions to my AWS scaling before a re-run

Opening my Elastic Beanstalk I can also view the degradation of my service. I will set about fixing those scaling rules to alleviate the end user impact.

We can cut the two minute evaluation period and the two minute breach duration down to one minute each. The current time to scale is four minutes, the new time to scale will be two minutes. This will add two instances to the pool — up to a maximum of four.

Now I need to test out my new scaling rules.
Performing a re-run

Again the setup() call into NerdGraph allows me to make an informed decision if to proceed with the load test — because I am testing in production. It is also important for me to be aware there is nothing degraded because it would spoil the results of my load test, and be unfair when I am comparing one test with another.
I could add logic into the setup() in the k6 script that is the application is in a state such as ALERTING, to cancel the load test run, for instance. It at least is making me aware of the state of the service, and bringing a level of context right into my load testing environment without even happening to open New Relic.

You can see in my application activity up top right there that my re run load test is happening. I am keeping an eye on the load test being registered within the service because it will become important for my analysis in the next section.
Fun fact: you can actually click right into those items in the application activity (such as deployments or alert violations) and get taken right into the finer detail.
Analysing the tests

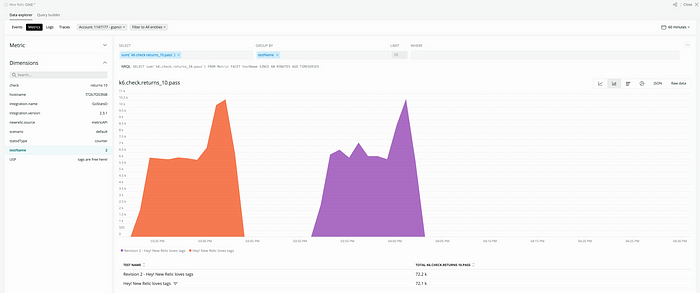
Here you can see that I have chosen the metric from the Data Explorer k6.check_returns_10.pass because this is the success criteria for every test in my load test — the response body has to return the number 10. ✨The magic number!✨ I have chosen the dimension on here testName which is a tag within my k6 load test. The New Relic StatsD supports multi-dimensional metrics.
The Data Explorer is the home for all of my telemetry data across my New Relic accounts. It is a one stop shop for viewing everything I am ingesting, and a fantastic starting point especially if I am unfamiliar with creating custom widgets — this takes much of the work out of building a query. I am familiar with New Relic for a few years (you might expect that from an employee 😉) but I still find the Data Explorer useful to view the metrics coming in and the different dimensions associated to the telemetry, I use it everyday when I am at work.

In the setup() and teardown() of m6 k6 script I am sending a deployment marker. It serves a few purposes including making everybody aware that the load test is starting/ending but another really cool purpose is that it will automatically generate reports within New Relic. I can send in metadata too such as the name of the test, and additional qualitative data in plain text which shows up on the change log section of the automatic report.

I have opened the automatically generated report and it provides me golden signals for my service and I can clearly see the start/end of both load tests in this view. I get some high level stats up top there. I also get the option to delete this report and its associated deployment marker (in case I failed and don’t want my boss seeing I spoiled their NR view 👀).

This view is really great. It shows me Active deployment and previous deployment of URLs. On some of the typically slowest pages such as /weirdmaths and /badmaths I can identify the response time is HALVED on those. This is a significant win for me. Check out the source code linked above from those URLs to see why they perform so slowly and generate high CPU load.

In this view I can see that my second load test resulted in way way less errors! Experienced by real/k6 users. See the scrubber where I mouse-overed to show the time of the second load test across all widgets there. This is also a fantastic win and success in my re-run of the load test.
Using the Deployment Analyzer App
Programmability within NR1 allows users to build applications on top of the New Relic platform, and deploy them to the App Catalog. (This is totally free for everyone!) There is an app on there called Deployment Analyzer which takes me a level further to look at my deployments — or in this case, the load tests.

I am first going to filter the Deployment Analyzer down to load test starts to get a nice view.

Here I see both the starts of my load tests. Now I can begin selecting data.

Using the Deployment Analyzer app gives me more control over the view I generate. I can filter down and compare load tests across many different services (not just my Node Workshop app). I could simply link this to somebody interested in the view across many services. You can see in the above GIF I can choose what to add or not add, filter on, and you can drive right into the service from the same interactive report.
Distributed Tracing

I can set about analysing the traces for the requests hitting my monitored app by opening up New Relic Distributed Tracing. I am going to use the filters up top and choose request.headers.userAgent like k6% so I am just seeing those k6 VU’s generated traces.

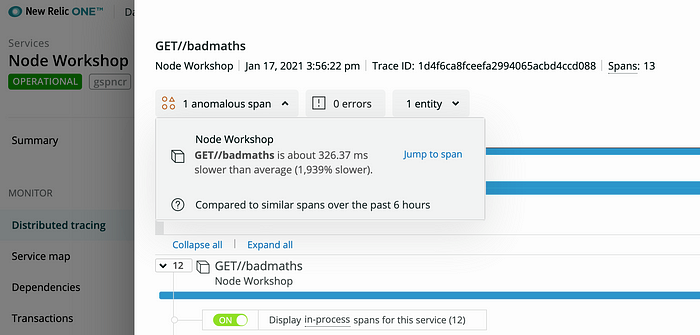
New Relic is comparing spans for various anomalies automatically. It has identified a span within this trace as being anomalous — at 1,939% slower than average! I can click on jump to span to investigate a little further.

I am getting some charts automatically generated and I am seeing this is definitely one of my slower traces — I am going to explore this transaction to see the breakdown of the transaction as picked up by the Node.js APM agent.

Most of my time is spent in the filesystem. This is clear to me, since the code behind this keeps generating random numbers until it gets the number 10. If only there was an easier way to print the number ten 🤔
Though you can see from this view if you had different dependencies, libraries, external services, databases and so on, increases in the breakdown would be shown here and be a quite critical piece of finding out degradations. In the past I have seen database clients get slowed down in load tests and this view helped me out back then.
This gives me the data to back up any decisions I make on the results of the load test. You could also extract this from the API and get smarter through building quality gates — wouldn’t it be cool to roll back a deployment made automatically with the results shown here?
Cool — how do I incorporate this in my tests?
Check it out in this GitHub Gist (built with @0x12b). Also, check out Awesome k6 where they have a load of cool snippets and resources similar.
Thanks to New Relic Life for the open platform and inspiration to do this, and thanks to Load Impact’s k6.io for the willingness to work together and create something cool for our mutual users! 🙌
